POSTED ON 20 MAR 2020
READING TIME: 5 MINUTES
Hypothesis testing of proportion-based samples


Part 2 of our Introduction to Hypothesis Testing series.
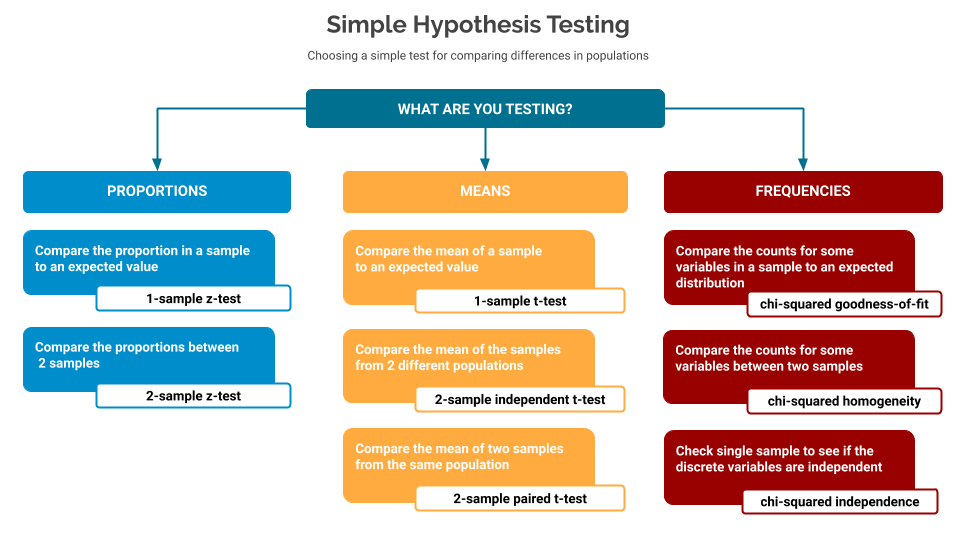
In part one of this series, I introduced the concept of hypothesis testing, and described the different elements that go into using the various tests. It ended with a cheat-sheet to help you choose which test to use based on the kind of data you’re testing.
In this second post I will go into more detail on proportion-based samples.
If any of the terms Null Hypothesis, Alternative Hypothesis, p-value are new to you, I’d suggest reviewing the first part of this series before moving on.
What is a proportion-based sample?
In these cases we’re interested in checking proportions. For example 17% of a sample matches some profile, and the rest does not. This could be a test comparing a single sample against some expected value, or comparing two different samples.
Note: These tests are only valid when there are only two possible options; and if the probability of one option is p, then the probability of the other must be (1 - p).
Requirements for the quality of the sample
For these tests the following sampling rules are required:
| Random | The sample must be a random sample from the entire population |
| Normal | The sample must reflect the distribution of the underlying population. For these tests a good rule of thumb is that:
|
| Independent | The sample must be independent - for these tests, a good rule of thumb is that the sample size is less than 10% of the total population. |
Code Samples for Proportion-based Tests
Note that all of these code samples are available on Github. They use the popular statsmodels library to perform the tests.
1-sample z-test
Compare the proportion in a sample to an expected value
Here we have a sample and we want to see if some proportion of that sample is greater than/less than/different to some expected test value.
In this example:
- We expect more than 80% of the tests to pass, so our null hypothesis is: 80% of the tests pass
- Our alternative hypothesis is: more than 80% of the tests pass
- We sampled 500 tests, and found 410 passed
- We use a 1-sample z-test to check if the sample allows us to accept or reject the null hypothesis
To calculate the p-value in Python:
from statsmodels.stats.proportion import proportions\_ztest

# can we assume anything from our sample
significance = 0.05

# our sample - 82% are good
sample\_success = 410
sample\_size = 500

# our Ho is  80%
null\_hypothesis = 0.80

# check our sample against Ho for Ha > Ho
# for Ha < Ho use alternative='smaller'
# for Ha != Ho use alternative='two-sided'
stat, p\_value = proportions\_ztest(count=sample\_success, nobs=sample\_size, value=null\_hypothesis, alternative='larger')

# report
print('z\_stat: %0.3f, p\_value: %0.3f' % (stat, p\_value))

if p\_value > significance:
   print ("Fail to reject the null hypothesis - we have nothing else to say")
else:
   print ("Reject the null hypothesis - suggest the alternative hypothesis is true")
2-sample z-test
Compare the proportions between 2 samples
Here we have two samples, defined by a proportion, and we want to see if we can make an assertion about whether the overall proportions of one of the underlying populations is greater than / less than / different to the other.
In this example, we want to compare two different populations to see how their tests relate to each other:
- We have two samples - A and B. Our null hypothesis is that the proportions from the two populations are the same
- Our alternative hypothesis is that the proportions from the two populations are different
- From one population we sampled 500 tests and found 410 passed
- From the other population, we sampled 400 tests and found 379 passed
- We use a 2-sample z-test to check if the sample allows us to accept or reject the null hypothesis
To calculate the p-value in Python:
from statsmodels.stats.proportion import proportions\_ztest
import numpy as np

# can we assume anything from our sample
significance = 0.025

# our samples - 82% are good in one, and ~79% are good in the other
# note - the samples do not need to be the same size
sample\_success\_a, sample\_size\_a = (410, 500)
sample\_success\_b, sample\_size\_b = (379, 400)

# check our sample against Ho for Ha != Ho
successes = np.array(\[sample\_success\_a, sample\_success\_b\])
samples = np.array(\[sample\_size\_, sample\_size\_b\])

# note, no need for a Ho value here - it's derived from the other parameters
stat, p\_value = proportions\_ztest(count=successes, nobs=samples,  alternative='two-sided')

# report
print('z\_stat: %0.3f, p\_value: %0.3f' % (stat, p\_value))

if p\_value > significance:
   print ("Fail to reject the null hypothesis - we have nothing else to say")
else:
   print ("Reject the null hypothesis - suggest the alternative hypothesis is true")
In the next post I will focus on hypothesis testing mean-based samples.