POSTED ON 16 JUL 2020
READING TIME: 9 MINUTES
Hypothesis testing of mean-based samples


Part 3 of our Introduction to Hypothesis Testing series.
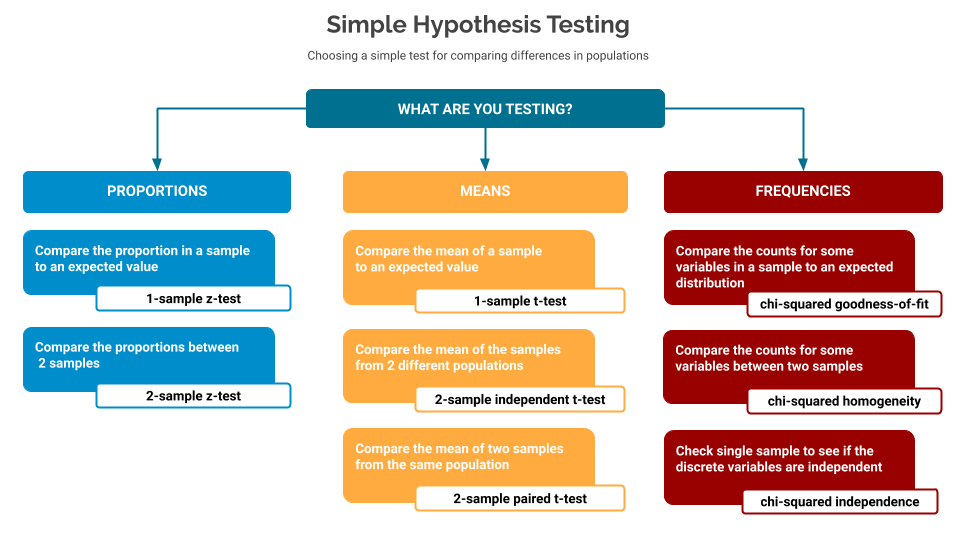
In part one of this series, we introduced the idea of hypothesis testing, along with a full description of the different elements that go into using these tools. It ended with a cheat-sheet to help you choose which test to use based on the kind of data you’re testing.
Part two outlined some code samples for how to perform z-tests on proportion-based samples.
This post will now go into more detail for mean-based samples.
If any of the terms - Null Hypothesis, Alternative Hypothesis, p-value - are new to you, then I’d suggest reviewing the first part of this series before carrying on with this one.
What is a mean-based sample?
In these cases we’re interested in checking the arithmetic mean of some samples. This could be checking if the sample’s mean matches some expected value, or comparing two samples from two different populations, or comparing two samples from the same population, taken before and after some intervention.
Requirements for the quality of the sample
For these tests the following sampling rules are required:
| Random | The sample must be a random sample from the entire population |
| Normal | The expected values in the sample must be “big enough” - for these tests a good rule of thumb is that - given the sample size - every variable’s expected count must be at least 5.For example: suppose a network was sized to have 5% real time traffic, and 95% best effort messages: this is our expected frequency.A sample size of 50 would mean we would “expect” approximately 2.5 real time traffic messages in this sample - this is less than 5 so the sample would be rejected as not being big enough. |
| Independent | The sample must be independent - for these tests a good rule of thumb is that the sample size be less than 10% of the total population. |
Tests for f-based samples
All of these code samples are available in this git repository They use the common statsmodels library to perform the tests.
1-sample t-test
Compare the proportion in a sample to an expected value
Here we have a - defined by a mean - and we want to see if we can make some assertion about whether the overall mean the underlying population is greater than / less than / different to some expected mean.
So, in this example, suppose we want to sample a call centre to check if the average call time is more than 2 minutes.
- Our null hypothesis is: the mean call time is exactly 2 minutes
- Our alternative hypothesis is: the mean call time is more than 2 minutes
- From one population we sampled 500 calls, and found a mean call time of 122 seconds, with a standard deviation of 73 seconds
- We use a 1-sample t test to check if sample allows us to accept or reject the null hypothesis
To calculate the p-value in Python:
from scipy.stats import truncnorm
from statsmodels.stats.weightstats import DescrStatsW as stats

# can we assume anything from our sample?
significance = 0.025

# we're checking if calls can be resolved in over 2 minutes
# so Ho == 120 seconds
null\_hypothesis = 120

# Normally, in the real world, you would process an entire sample (i.e. sample\_a)
# But for this test, we'll generate a sample from this shape, wherE:
# - min/max is the range of available options
# - sample mean/dev are used to define the normal distribution
# - size is how large the sample will be
min, max, sample\_mean\_a, sample\_dev\_a, sample\_size\_a = (0, 300, 121, 50, 500)

########################
# here - for our test - we're generating a random string of durations to be our sample
# these are in a normal distribution between min/max, normalised around the mean
sample\_a = truncnorm(
  (min - sample\_mean\_a) / sample\_dev\_a,
  (max - sample\_mean\_a) / sample\_dev\_a,
  loc=sample\_mean\_a,
  scale=sample\_dev\_a).rvs(sample\_size\_a)

# Get the stat data
(t\_stat, p\_value, degree\_of\_freedom) = stats(sample\_a).ttest\_mean(null\_hypothesis, 'larger')
# report
print('t\_stat: %0.3f, p\_value: %0.3f' % (t\_stat, p\_value))

if p\_value > significance:
  print("Fail to reject the null hypothesis - we have nothing else to say")
else:
  print("Reject the null hypothesis - suggest the alternative hypothesis is true")
2-sample independent t-test
Compare the mean of the samples from 2 different populations
Here we have two samples - taken from two different populations - defined by a mean - and we want to see if we can make some assertion about whether the overall means of one the underlying populations is greater than / less than / different to the other.
So, in this example, suppose we want to compare two different call centres to see how their call times relate to each other.
- We have two samples - A and B: our null hypothesis is: the means from the two populations are the same
- Our alternative hypothesis is: the means from the population A > mean from population B
- From one population we sampled 500 calls, and found a mean call time of 121 seconds, with a standard deviation of 56 seconds.
- From the other population we sampled 500 calls, and found a mean call time of 125 seconds, with a standard deviation of 16 seconds
- We use a 2-sample independent t-test to check if sample allows us to accept or reject the null hypothesis
To calculate the p-value in Python:
from scipy.stats import truncnorm
from statsmodels.stats.weightstats import ttest\_ind

# can we assume anything from our sample?
significance = 0.025

# we're checking if calls can be resolved in over 2 minutes
# so Ho == 120 seconds
null\_hypothesis = 120

# Normally, in the real world, you would process an entire sample (i.e. sample\_a)
# But for this test, we'll generate a sample from this shape, wherE:
# - min/max is the range of available options
# - sample mean/dev are used to define the normal distribution
# - size is how large the sample will be
min, max = (0, 300)
sample\_mean\_v1, sample\_dev\_v1, sample\_size\_v1 = (121, 56, 500)
sample\_mean\_v2, sample\_dev\_v2, sample\_size\_v2 = (125, 16, 500)

########################
# here - for our test - we're generating a random string of durations to be our sample
# these are in a normal distribution between min/max, normalised around the mean
sample\_v1 = truncnorm(
(min - sample\_mean\_v1) / sample\_dev\_v1,
(max - sample\_mean\_v1) / sample\_dev\_v1,
loc=sample\_mean\_v1,
scale=sample\_dev\_v1).rvs(sample\_size\_v1)

sample\_v2 = truncnorm(
(min - sample\_mean\_v2) / sample\_dev\_v2,
(max - sample\_mean\_v2) / sample\_dev\_v2,
loc=sample\_mean\_v2,
scale=sample\_dev\_v2).rvs(sample\_size\_v2)

# Get the stat data
# note that we're comparing V2 to V1 - so the sample we expect to be larger goes first here
(t\_stat, p\_value, degree\_of\_freedom) = ttest\_ind(sample\_v2, sample\_v1, alternative='larger')

# report
print('t\_stat: %0.3f, p\_value: %0.3f' % (t\_stat, p\_value))

if p\_value > significance:
 print("Fail to reject the null hypothesis - we have nothing else to say")
else:
 print("Reject the null hypothesis - suggest the alternative hypothesis is true")
2-sample paired t-test
Compare the mean of two samples from the same population
Here we have two samples - taken from the same population - defined by a mean - and we want to see if we can make some assertion about whether the mean of the underlying population in the second sample is greater than / less than / different to how it was in the first.
So, in this example, suppose we have made some code change and it looks like it has slowed things down, and so we want to sample the performance from before and after the change, to see if things have really slowed down.
- We have two samples - A and B: our null hypothesis is: the means from the two populations are the same
- Our alternative hypothesis is: the means from the population A > mean from population B
- Before the change, we sampled 500 events from the population, and found a mean processing time of 121 milliseconds, with a standard deviation of 56 milliseconds.
- After the change, we sampled 500 events from the population, and found a mean processing time of 128 milliseconds, with a standard deviation of 16 milliseconds.
- We use a 2-sample paired t-test to check if sample allows us to accept or reject the null hypothesis
NOTE: in this case it is assumed that the same elements have been sampled multiple times. So, this is, in effect, a 1-sample t test on the differences between the two samples with:
- Null hypothesis: difference is 0
- Alternative hypothesis: difference is greater than 0
To calculate the p-value in python
from scipy.stats import truncnorm
from statsmodels.stats.weightstats import DescrStatsW as stats

# can we assume anything from our sample?
significance = 0.05

# we're checking if calls can be resolved in over 2 minutes
# so Ho == 120 seconds
null\_hypothesis = 120

# Normally, in the real world, you would process an entire sample (i.e. sample\_a)
# But for this test, we'll generate a sample from this shape, wherE:
# - min/max is the range of available options
# - sample mean/dev are used to define the normal distribution
# - size is how large the sample will be
min, max = (0, 300)
sample\_mean\_v1, sample\_dev\_v1, sample\_size\_v1 = (121, 56, 500)
sample\_mean\_v2, sample\_dev\_v2, sample\_size\_v2 = (125, 16, 500)

########################
# here - for our test - we're generating a random string of durations to be our sample
# these are in a normal distribution between min/max, normalised around the mean
sample\_v1 = truncnorm(
 (min - sample\_mean\_v1) / sample\_dev\_v1,
 (max - sample\_mean\_v1) / sample\_dev\_v1,
 loc=sample\_mean\_v1,
 scale=sample\_dev\_v1).rvs(sample\_size\_v1)

sample\_v2 = truncnorm(
 (min - sample\_mean\_v2) / sample\_dev\_v2,
 (max - sample\_mean\_v2) / sample\_dev\_v2,
 loc=sample\_mean\_v2,
 scale=sample\_dev\_v2).rvs(sample\_size\_v2)

# Get the stat data
# note that this is, in effect, a sample t-test on the differences
# we want to see if v2 is slower than V1 so we get the differences and check the probability that they
# are larger than the null hypothesis here (of the default = 0.0)
(t\_stat, p\_value, degree\_of\_freedom) = stats(sample\_v2 - sample\_v1).ttest\_mean(alternative='larger')

# report
print('t\_stat: %0.5f, p\_value: %0.5f' % (t\_stat, p\_value))

if p\_value > significance:
  print("Fail to reject the null hypothesis - we have nothing else to say")
else:
  print("Reject the null hypothesis - suggest the alternative hypothesis is true")
In the next post I will focus on testing of frequency-based samples.