POSTED ON 13 MAY 2020
READING TIME: 5 MINUTES
VisiMetrix™ - new feature releases
A brief overview of the latest VisiMetrix™ product updates that are laying the foundation for the next generation of Network Operation Center (NOC).
Responding to the COVID-19 crisis
There’s no doubt that telecom network operators have been faced with significant challenges during the COVID-19 crisis. During a recent Analytics Institute Ireland webinar, Mairead Cullen, Vodafone Ireland’s CIO, outlined the changing usage patterns that they have observed, with a particularly strong surge in fixed broadband traffic. Such rapid changes present challenges for operators both in terms of the volume and the geographic spread of capacity as people moved to work from home.
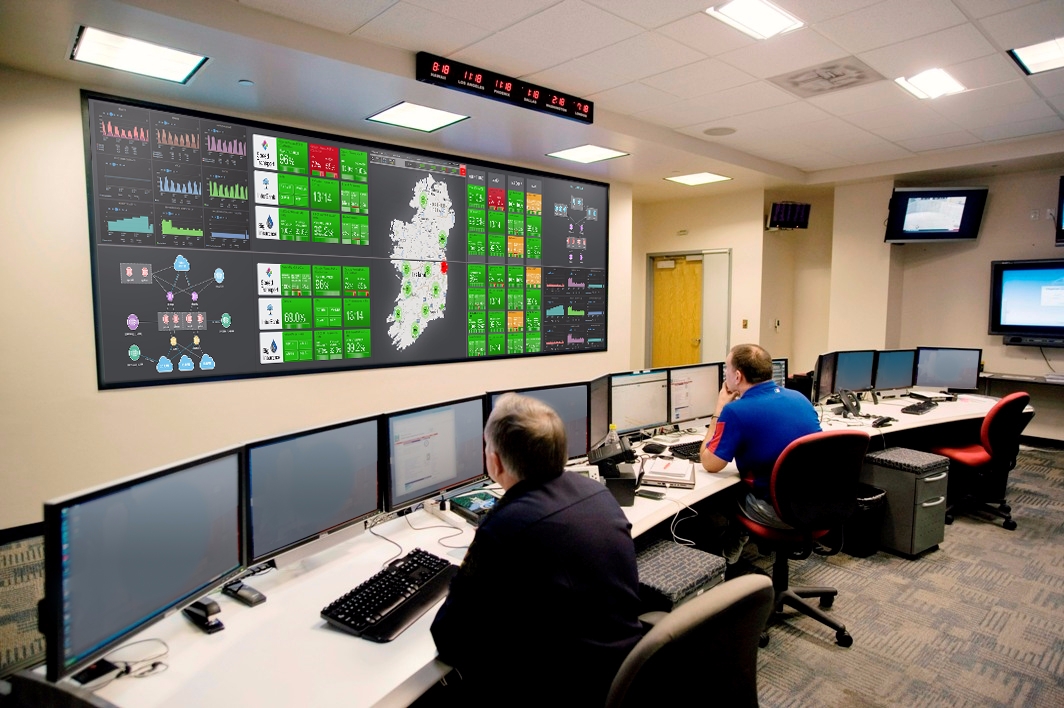
So how have operators been coping with these sudden and unforeseen changes?. Well we witnessed an increased number of logins to our VisiMetrix™ platform at the start of each day and repeat logins throughout the week since early to mid-March. Network Operation Centre (NOC) engineers have come to rely less on the large wallboard displays and more on the personalised Virtual NOC displays offered by VisiMetrix™. We’ve been busy responding to customers by helping them to generate new executive-level reports and by increasing the scope of systems monitored across the network, enabling better data-driven decision making. The feedback has been very positive, with an increased recognition of the business value of VisiMetrix™ across our customers’ organisations.
VisiMetrix™ is constantly evolving based on new research and innovation as well as valuable customer feedback as we introduce new features.This short post will give you a flavour of some of the new developments that we have delivered to the market recently.
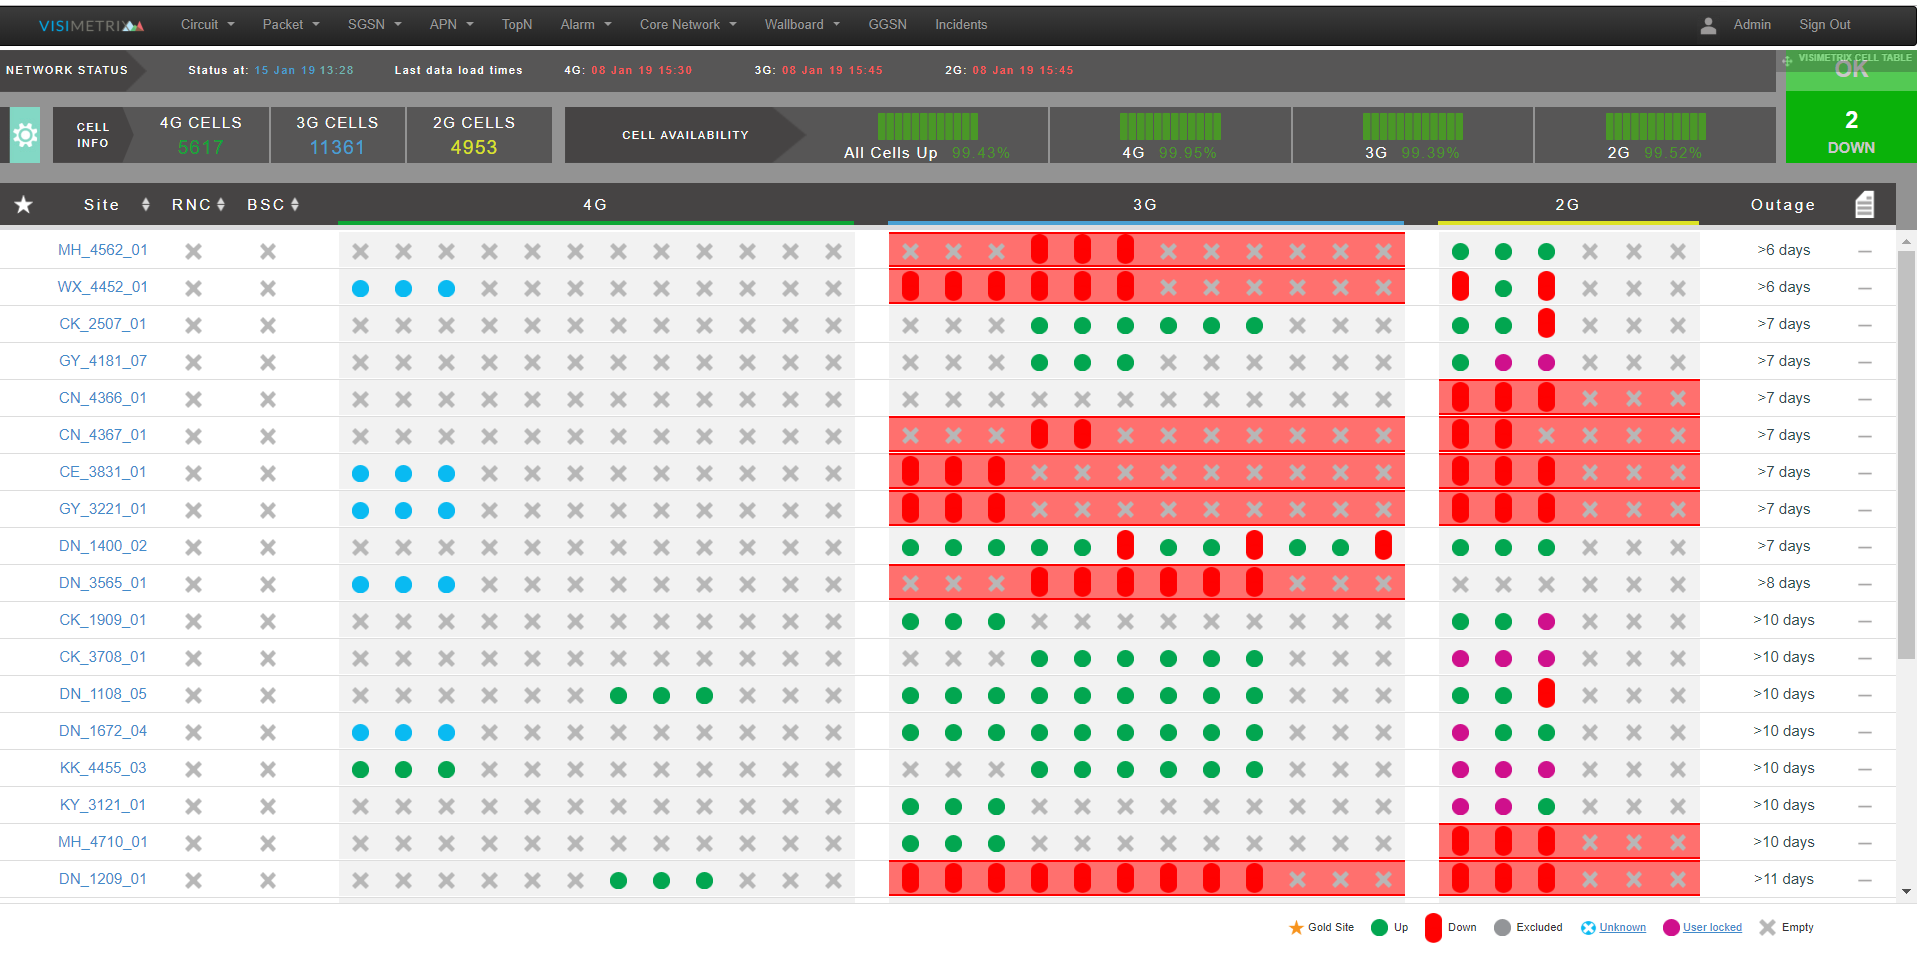
Supporting 5G rollouts
For end customers, 5G may look like just a faster version of 4G. However for network operators, 5G introduces a completely new architecture from Access right through to Core. To assist this transformation, we have added 5G cell data and 5G network overview statistics to our ever-growing suite of KPI data. We’ve been able to build these dashboards in an extensible manner so that when new cells and sites come on stream their data gets auto-populated into the system. We’ve also mapped and aggregated 5G KPI data to show common network technology summary information for all technologies in the network.
Transmission network - performance KPI improvements
While VisiMetrix™ has long supported the representation of access networks, we can now display how links within a cluster are connected as in the diagram below indicating connectivity between the Aran Islands. Furthermore we can overlay a status indicator to highlight a particular KPI performance. This is a powerful and visually appealing method of quickly viewing problem links within the network.
![]()
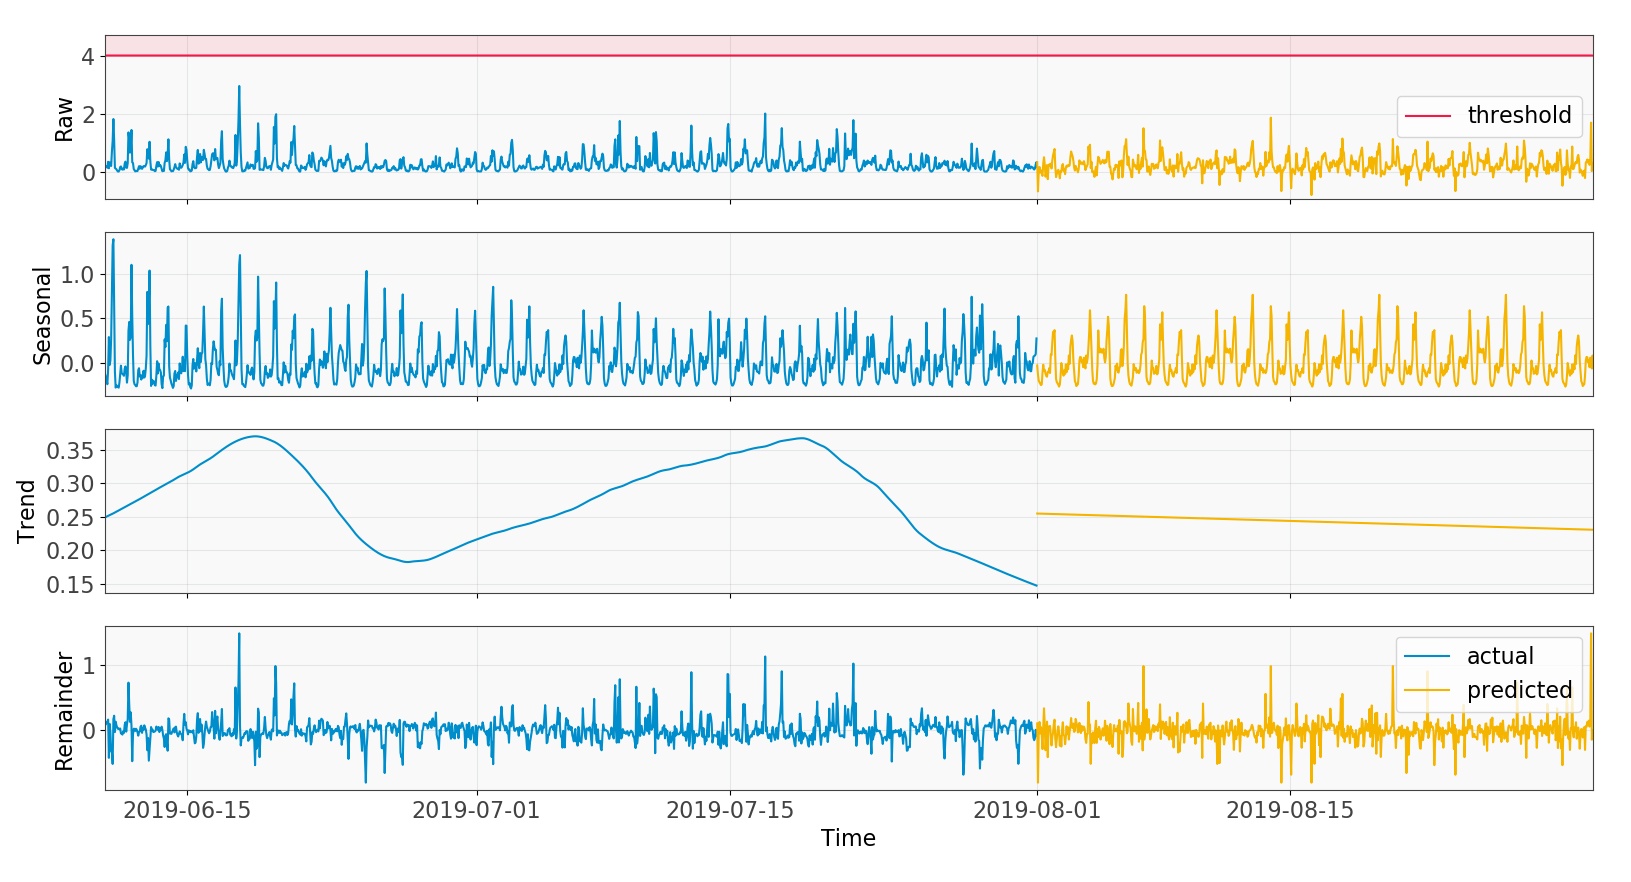
Predictive analytics - network congestion
Our VisiMetrix™ roadmap is managed within an agile process that supports regular rollout of new features across our themes of strategic evolution. These are sometimes informed by collaboration with the innovation groups of our customers. We are excited about the work that we’ve completed in the area of Network Congestion with Vodafone. Our recent post Applying Analytics and Data Science in Telecoms – Network Congestion Forecasting gives more detail of this project, one of the innovations within the theme of predictive capabilities in VisiMetrix™.
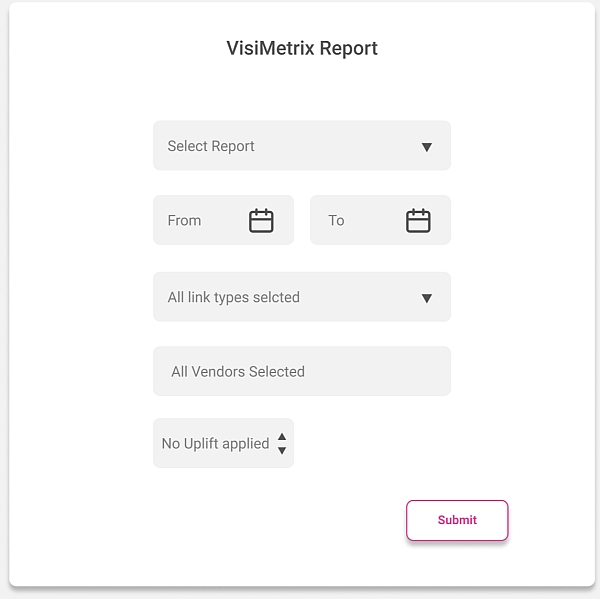
Reporting improvements
We’ve redesigned our Report Portlet to make it easier to customize the reports that users most frequently return to. This new design allows a user to select a pre-canned report and it then dynamically populates the report parameters in an easy to use dialog as displayed below. Reports can also be emailed once generated and regular scheduled emails can be easily configured.
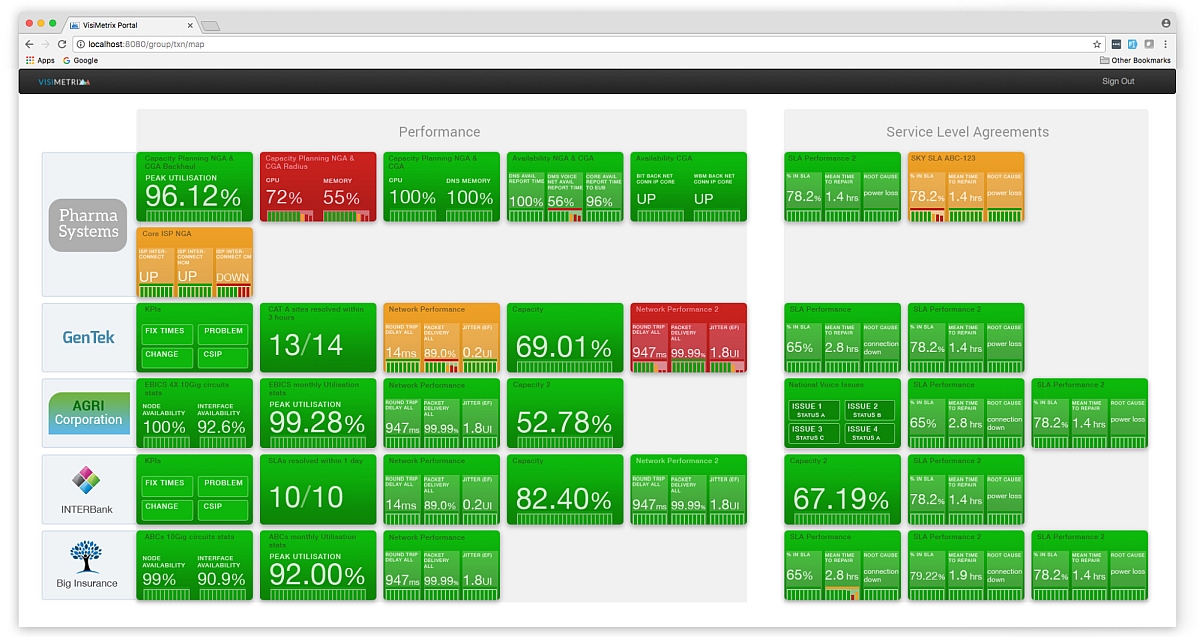
Service Management views
The most recent version of VisiMetrix™ layers in Customer Service Levels and Contractual agreements. This is an exciting development that allows us to tailor-make views and dashboards that not only display the ‘here and now’ status of your network but also the performance of your network against your service level agreements. This is an invaluable additional layer of information on your data and provides vital information to your customer account management teams.
Enhanced wallboard visualisations
We place huge value on the application of advanced UX principles to dashboard design, and we are constantly working on evaluating new approaches and techniques. To that end we keep abreast of new developments and were excited to be part of the first DataViz Live conference held recently in London. We have blogged about our experience at this conference here: Takeaways from DataViz Live Conference. As we consider the user and their context we will continue to evolve the correct representation of data to keep our users informed and empowered.
We hope this tour of new features has been of interest to you. We continue to work on our feature roadmap, and just one exciting new project is in the area of applying machine learning techniques to anomaly detection.
How does it work in a real environment?
If you want to see how VisiMetrix™ works in real-life scenarios – sign up for one of our live demonstration sessions where our product team will guide you through its basic concepts and demonstrate how VisiMetrix™ can help you transform your network operations.