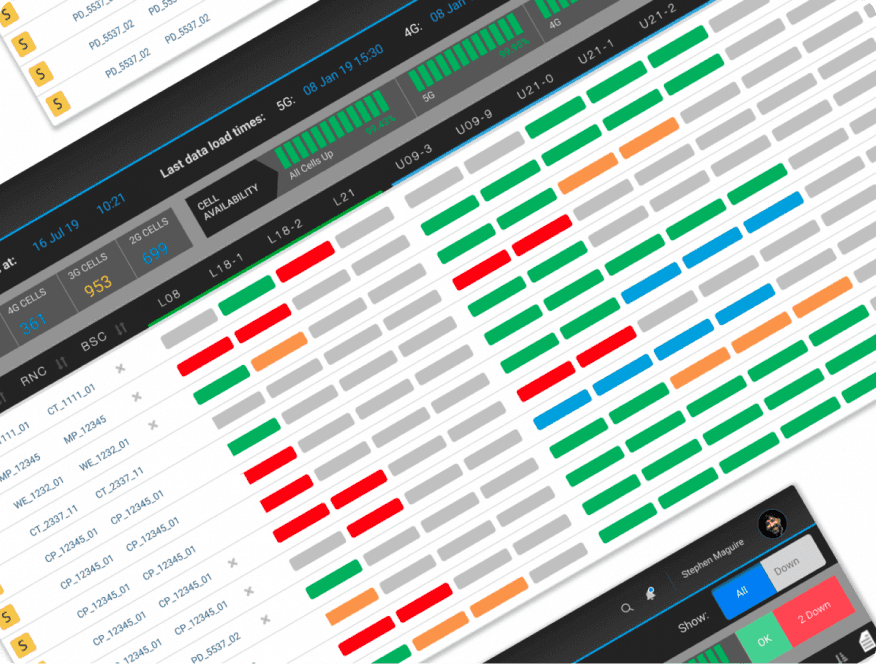
VisiMetrix provides Three Ireland with the intelligence to monitor and proactively respond to service related issues within the network, often before these issues can impact customers. Its powerful alerting, network visualisations and dynamic thresholding abilities can highlight inter-dependencies and hotspots quickly, clearly and directly to network operations teams.
VisiMetrix
UX excellence
A quality user experience will encourage adoption across the organisation. User-friendly dashboards help you leverage valuable data assets that can now be collected in one place.
Turn complex data into intuitive visuals
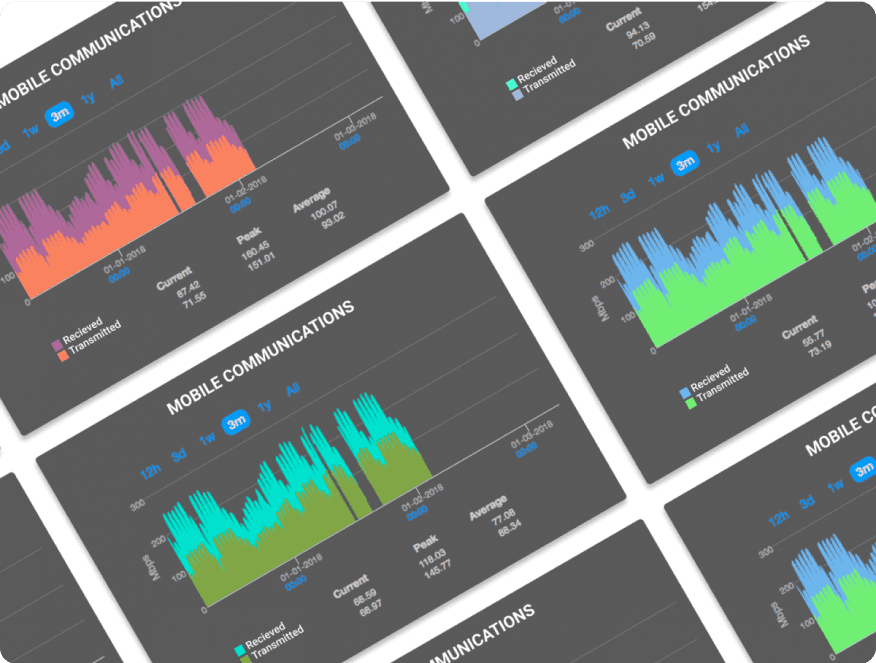
VisiMetrix was designed for users, striking a balance between data granularity and information-at-a-glance. Users can create bespoke journeys through the data, with highly personalised maps, schemas and other visual representations that bring data to life.
Its visual representations make it easy to access, modify and interpret the data that you choose to see. It balances flexibility with ease of use.

Data presentation options
The feature rich portal allows you to create custom user dashboards to suit your needs, including:
- Bespoke wallboard visualisations for large, mission critical Network Operations Centres
- Executive dashboards to get real time info to your C-suite
- Granular views to enable performance monitoring, analysis and troubleshooting for technical teams
- Enterprise views allow nodes to be partitioned based on customers, for account managers or individual customers

Advanced KPI visualisation
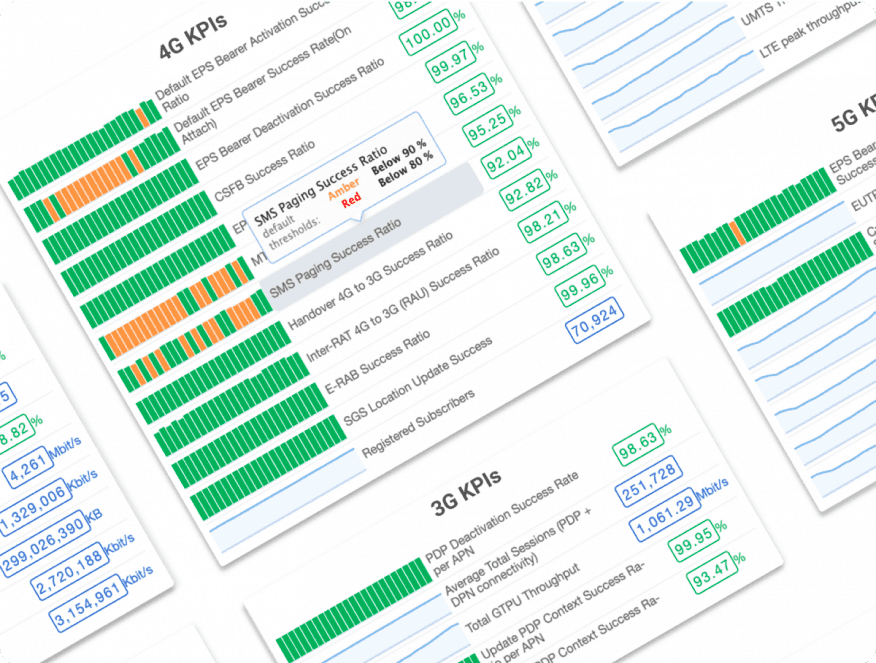
In addition to providing bespoke dashboard views, VisiMetrix has advanced thresholding and KPI management features. KPIs are colour coded and displayed in appealing visuals that make it easier to interpret complex data.
KPIs can be visualised in a variety of formats. This includes geographic map views that let you assess your network’s current status and its changing status over time.
