POSTED ON 28 MAY 2020
READING TIME: 7 MINUTES
Quantitative analysis is as subjective as qualitative analysis


That’s a bold claim
It is, but I hope that by the end of this blog post you will agree with me. I’m not dismissing quantitative analysis - it’s always better than a gut feeling - but when you analyse data you’re making lots of choices about what tools to use, and what the results mean.
The aim of this post is to make clear the nature of the kinds of choices an analyst will make when examining data, and what responsibility is on you - the reader - to understand these choices before accepting the results of someone else’s analysis.
What we talk about when we talk about quantitative analysis
At a high level, all we mean is that we’ve given our data over to a set of tools that can validly test it, and they’ve given us a p-value for how likely this observation is to be a fluke. From here on, how we interpret this is up to us.
I think it’s best to explain this with a simple example, so you can see what kind of interpretations an analyst will make. If you’re new to this kind of analysis then don’t panic, you don’t really need to understand everything going on in here to get the main thesis of the post.
Finally, there are some tables of data in here, for context, but if this is all new to you then you can skip through them to the text.
First make your assumption
Suppose we had two classes in a school that did a few exams in different subjects, and when we got the average score for their tests across all subjects we got results like this.
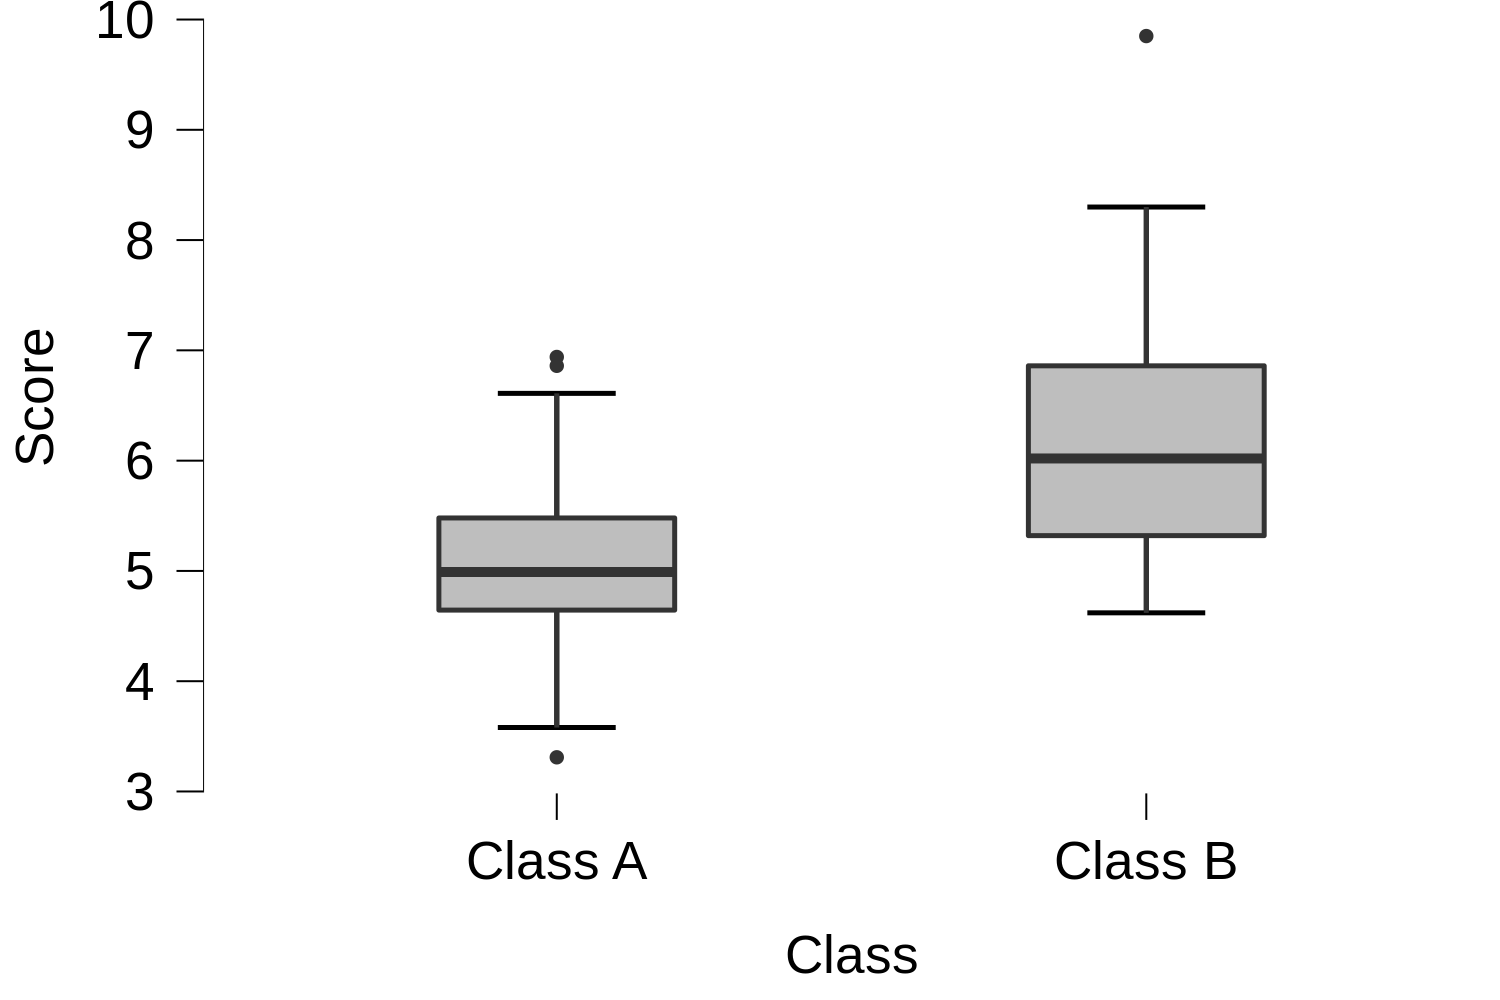
So, it looks like Class B might be getting better scores than Class A. However, as the scores within each are spread out a bit, and there’s a lot of overlap between the two classes, it could be a fluke. Maybe if you tested next week Class A could have done better than Class B.
Now look a little deeper
So, you decide to throw your data into an interaction plot, to see if there’s anything of interest going on when you compare all the classes and subjects at the same time. The result is this:
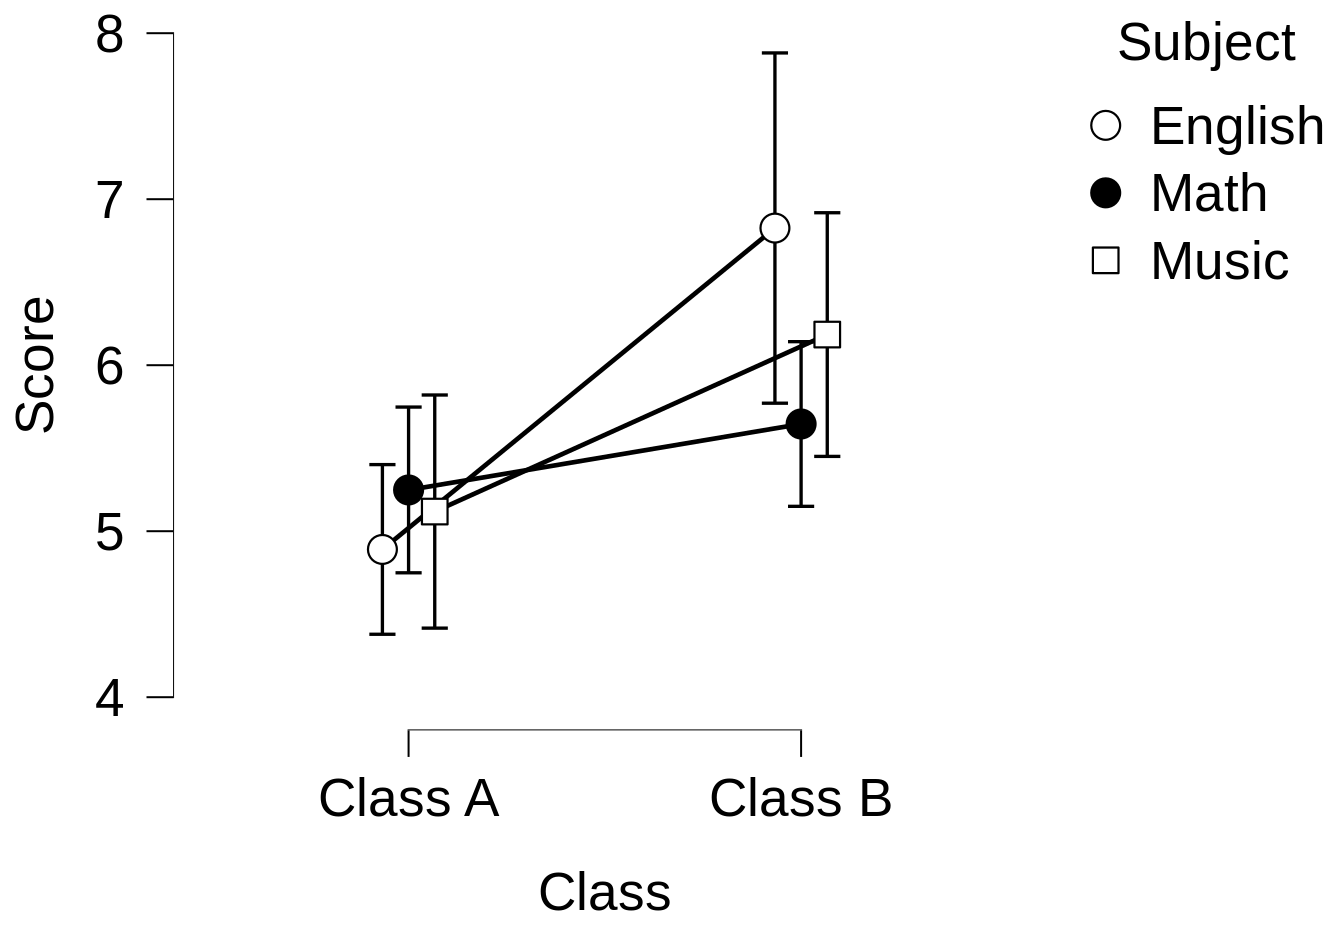
Now, since the lines aren’t parallel to each other, it looks like there might be some kind of interaction taking place, so we do the full Analysis of Variance test to make sure.
| Cases | Sum of Squares | df | Mean Square | F | p |
|---|---|---|---|---|---|
| Subject | 1.966 | 2 | 0.938 | 0.960 | 0.388 |
| Class | 22.000 | 1 | 22.00 | 21.48 | < .001 |
| Subject ✻ Class | 6.911 | 2 | 3.456 | 3.374 | 0.04 |
| Residuals | 64.517 | 63 | 1.024 |
Assuming we’re happy with a significance level of 5%, then the results suggest the following:
- With a p-value of less than 0.001 (which is less than our significance of 5%) , there’s a main effect for “Class” - i.e. the classes are significantly different to each other.
- With a p-value of 0.388 (>5%), there’s no main effect for “Subject”
- With a p-value of 0.041 (<5%), there is a significant interaction between “Subject” and “Class.”
Choices… choices…
You generally - but not always - ignore main effects when you have a significant interaction, but first you have to decide if this is a meaningful significant interaction, or one you can ignore.
Since all ANOVA can do is tell us that there is some kind of interaction between class and subject, we use a post-hoc test to throw some light on which interactions are happening. In this example, we do a Tukey HSD on the interactions to see how all the different class/subject pairs interact with each other. Although the analyst has many other post-hoc tests to choose from.
Post Hoc Comparisons - Subject ✻ Class
| Mean Difference | SE | t | p tukey | ||
|---|---|---|---|---|---|
| English, Class A | Math, Class A | -0.358 | 0.405 | -0.885 | 0.949 |
| Music, Class A | -0.228 | 0.415 | -0.550 | 0.994 | |
| English, Class B | -1.936 | 0.426 | -4.548 | < .001 *** | |
| Math, Class B | -0.756 | 0.405 | -1.866 | 0.432 | |
| Music, Class B | -1.295 | 0.415 | -3.123 | 0.031 * | |
| Math, Class A | Music, Class A | 0.130 | 0.422 | 0.308 | 1.000 |
| English, Class B | -1.578 | 0.433 | -3.641 | 0.007 ** | |
| Math, Class B | -0.397 | 0.413 | -0.962 | 0.928 | |
| Music, Class B | -0.936 | 0.422 | -2.216 | 0.245 | |
| Music, Class A | English, Class B | -1.708 | 0.442 | -3.862 | 0.003 ** |
| Math, Class B | -0.528 | 0.422 | -1.249 | 0.811 | |
| Music, Class B | -1.066 | 0.432 | -2.471 | 0.148 | |
| English, Class B | Math, Class B | 1.180 | 0.433 | 2.724 | 0.085 |
| Music, Class B | 0.641 | 0.442 | 1.451 | 0.696 | |
| Math, Class B | Music, Class B | -0.539 | 0.422 | -1.275 | 0.797 |
* p < .05, ** p < .01, *** p < .001
| DANGER, WILL ROBINSON!There is a risk here in doing this kind of test. The more interactions that take place, the easier it is to find something that looks to be significant, but isn't. The post-hoc tests attempt to prevent this, but you should always keep your wits about you. |
There’s a lot in here, so let’s focus only on those results we can consider as being statistically significant. These are:
- There are only 4 significant interactions.
- Class A’s English test score is significantly different to Class B’s English test score. This is probably a real difference, since it’s the same subject being tested.
- Class A’s English test score is significantly different to Class B’s Music test score. These are different classes and different subjects, so the difference is probably meaningless.
- Same goes for the differences between Class B’s English scores and Class A’s Maths and Music scores.
So we could, reasonably, come to the conclusion that:
- There is some difference between the classes.
- But only for the English tests.
Of course, had we decided that all the interactions were not interesting, we would have moved onto to doing post-hoc tests on the main effects
Check yourself before you wreck yourself
So, what’s wrong with this?
Maybe nothing - if our decisions were reasonable - but it should be clear that although we used quantitative methods to decide what was statistically significant, we still made qualitative decisions on what was meaningful.
So, in short, there are three main lessons to take from this: [fusion_table]
|