POSTED ON 14 FEB 2018
READING TIME: 5 MINUTES
Monitoring end-to-end enterprise application performance
As enterprises become increasingly reliant on complex, distributed software applications, IT operations has a critical role to play in ensuring application performance and availability. Modern enterprise applications comprise many distinct and distributed software elements, each of which has a part to play in the experience ultimately delivered to users. Understanding application performance from the perspective of end users requires a view of performance metrics across the distinct elements that comprise the application. Of course, while these hard numbers serve as a good baseline understanding of actual performance, the perceived performance may in fact be better.
Perceived performance is how fast a user thinks the application is, not necessarily how fast your technical stats say it is. Much of the effort to improve perceived performance is focused on non-technical elements related to application UX and UI design. As it is subjective, it is difficult to measure. Luckily, the actual performance has a strong influence on the perceived performance, and can be more readily measured.
Where to Measure?
- Server-side – Monitoring the server-side provides insight into the software components that comprise the application. This information can be used to diagnose issues across the application stack, for example web servers, application servers and databases.
- Client-side – Monitoring the client-side provides insight into how and when users interact with the application and when server processing of those interactions are available to the users. These measurements provide an insight as to the user experience.
- Network Infrastructure – Monitoring network infrastructure can provide insight into environmental conditions over time.
The true value of these metrics is uncovered when they are combined to provide a holistic view of application performance. They can also be correlated to aid problem diagnosis.
Sonalake Verax NMS
At Sonalake most of our monitoring projects integrate with complex heterogeneous environments consisting of a variety of software application elements as well as specialist hardware platforms. Verax NMS instruments these elements to provide integrated service, application and infrastructure management and monitoring.
Web Server Web server monitoring is performed by NMS plugins. The plugins not only measure performance of the monitored web servers, for example request count, but also provide profiling statistics on the URLs visited and errors encountered. These statistics can be used to determine and improve the user workflow. The plugins can also raise alarms in case any errors are detected. They provide direct end-user information: response times and user paths. However, the underlying causes of low performance require information from other elements of the service.
Application Server Application server monitoring is performed by Apache Tomcat, IBM WebSphere, .NET or other plugins. These measure performance and responsiveness of the application servers, and can be used to identify situations when the user experience is low because of performance problems. The plugins can monitor application server metrics, for example via JMX, and raise alarms when resources are insufficient to provide quality service.
Databases Virtually all enterprise applications rely on one or more databases. NMS provides plugins for monitoring of virtually all industry-leading database systems. The database plugins also provide elements of profiling; for example top queries by frequency, top queries by resource usage. These can help identify situations when user experience is low due to database performance problems.
Middleware and Support Systems Applications can also depend on other systems such as, for example, message brokers (ActiveMQ, MessageQ), authentication servers (LDAP, RADIUS, Active Directory). Availability and performance of these systems may affect the core system and user experience. NMS supports sensors to validate the health and performance of these.
How it Works
What Verax NMS does in order to monitor the perceived performance is to collect data from across the application stack and present it in a comprehensive way to the IT operations staff tasked with ensuring its availability and performance.
It is important to emphasize that the measurements only provide guidance to improvements of the system by helping to identify elements that require attention. Very often, the results are ambiguous and difficult to interpret. In such cases, we help our customers to analyze the situation and find an optimal solution.
Real life scenario - Telecommunications Operator
We have implemented the performance measurements described above as part of a wider network and infrastructure monitoring programme for a telecommunications operator. The architecture comprises a login gateway and self care portal coupled with AAA Radius authentication. The operator’s portal is a LAMP (Linux/Apache/MySQL/PHP) application with clustering and failover running on a VMware environment.
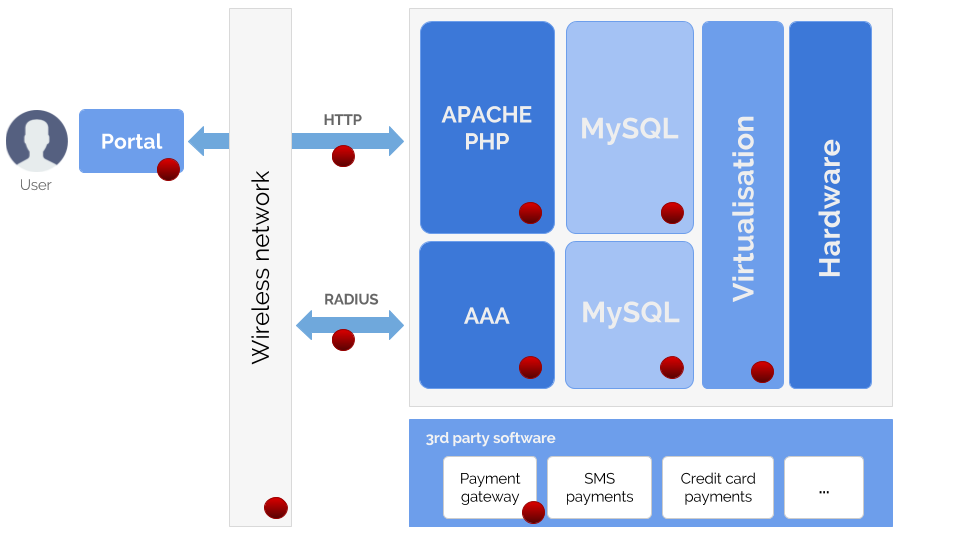 Example of perceived performance monitoring schema for the telco operator case
(red dots indicate key measurement points).
High perceived performance factors were required by the operator in order to retain and grow the customer base in this highly competitive market. In the course of the NMS & APM implementation, the following key EUE issues have been addressed:
- Responsiveness of the login & self care portal.
- Usability and navigation paths in the portal.
- “Smoothness” of the login process from displaying the first HTTP page to authentication in the AAA (total time from start to the moment when network access is granted).
- Stability of AAA sessions in network saturation conditions.
Based on the data collected over time we identified numerous improvements, mostly configuration-related but also some software-related, that resulted in manifest improvements to performance without needing to modify the hardware infrastructure.
Summary
Perceived performance measurement is an important evolution in IT monitoring systems. It is essential for businesses to keep clients satisfied, increase loyalty, reduce churn and stay competitive. If you’d like to learn more about our service-oriented approach to perceived performance monitoring – simply request a live demonstration session where our technical team will guide you through the basic concepts and demonstrate how it can help simplify and automate IT infrastructure management.