POSTED ON 14 JUN 2019
READING TIME: 6 MINUTES
Instrumenting software with Micrometer
In recent years many of our clients have embraced microservices. This architectural pattern employs software services that are more fine-grained and heterogeneous than their monolithic predecessors and aim to bring productivity and performance gains by allowing teams to work in parallel and systems to scale horizontally and, in doing so, enable faster feature delivery.
There’s no such thing as a free lunch though - microservices come at an operational cost. In the world of the monolith tracking down a production issue may well be as straightforward as tailing and grepping a single log file. In the world of microservices we may have 10-100s of distributed software services, running containers - how can engineers build a picture of what’s happening in the system? How can they carry out root cause analysis to identify performance bottlenecks?
The answer is by instrumenting the services and exposing meaningful metrics.
Metrics
In the abstract, a metric can be described as a unit of length - any numerical value characterising the software that can be easily compared with other numerical values within the same category. Examples include number of cache hits, time to invoke certain flow/method or, in the context of JVM-based solutions Garbage Collector pause time.
There are many existing approaches to monitoring metrics, with differences in the way metrics are collected (push or pull), differences in architecture (client-side or server-side), as well as differences in metric transport and storage mechanism. Despite these differences, they all aim to solve the same problem and, as developers, we are challenged with making technology choices in a fast-changing monitoring space.
To decouple the software we build from that of the systems we use to instrument it is to make use of an API. Micrometer is a library that exposes such an API and one that we’ve had great success using.
Micrometer
Micrometer is a library that acts as a facade for monitoring systems. As it says on the website, "Think SLF4J, but for metrics". It provides a unified API to most popular monitoring systems, allowing you to instrument your JVM-based application code without vendor lock-in.
Here's a selection of the systems Micrometer supports, there are a bunch more listed in the official documentation.
| System | Type |
|---|---|
| Atlas | In-memory dimensional time series database |
| Datadog | Dimensional time-series SaaS |
| Elastic | Search and analytics platform |
| Ganglia | Hierarchical metrics system |
| Graphite | Hierarchical metrics system |
| InfluxDB | Time series database |
| Prometheus | In-memory dimensional time series database |
| Wavefront | SaaS monitoring platform |
In addition, Micrometer is now included as part of Spring Boot Actuator 2.x so it is already a part of the well known and widely used Spring stack. It provides four main methods of measurements:
- Timer - measure short-duration latencies and the frequency of such events
- Distribution Summary - track the distribution of non-temporal event attribute
- Counter - increment a value by a fixed amount
- Gauge - monitor things with natural upper bounds (e.g. CPU load)
I’m not going into the details of what these are used for exactly, since authors of Micrometer already did a great in the documentation.
Within Spring Boot Actuator 2.x, as a part of Spring autoconfiguration, Micrometer gets integrated with applications by providing a set of Beans that can be further used for monitoring purposes. For example, if we want to monitor and measure the time taken for certain methods to end, it’s as simple as annotating the Spring managed Bean method. Alternatively we have the option of using the Micrometer Timer API. In a simplified way implementation will look as follows:
Annotation based
@Timed(value = "add-book-flow")
public BookDTO addBook(BookDTO bookDTO) {
    validate(bookDTO);

    Book book = fromDTO(bookDTO);

    return saveBook(book);
}
API based
public BookDTO addBook(BookDTO bookDTO) {
     return timer.record(() -> {
         validate(bookDTO);

         Book book = fromDTO(bookDTO);

         return saveBook(book);
     });
 }
Conveniently, Micrometer also provides a legacy bridge that can be used to integrate older Spring 1.5 applications with Micrometer library.
Visualisation
Assuming that we successfully integrated with a metrics collecting system and exposed desired data the question arises as to what we can do with the data. The most popular answer to that question will likely be Grafana. Grafana is a powerful visualisation and alerting system for metrics. It ships with predefined dashboards and supports over thirty metric data sources. Users can also configure custom dashboards like the one shown below.
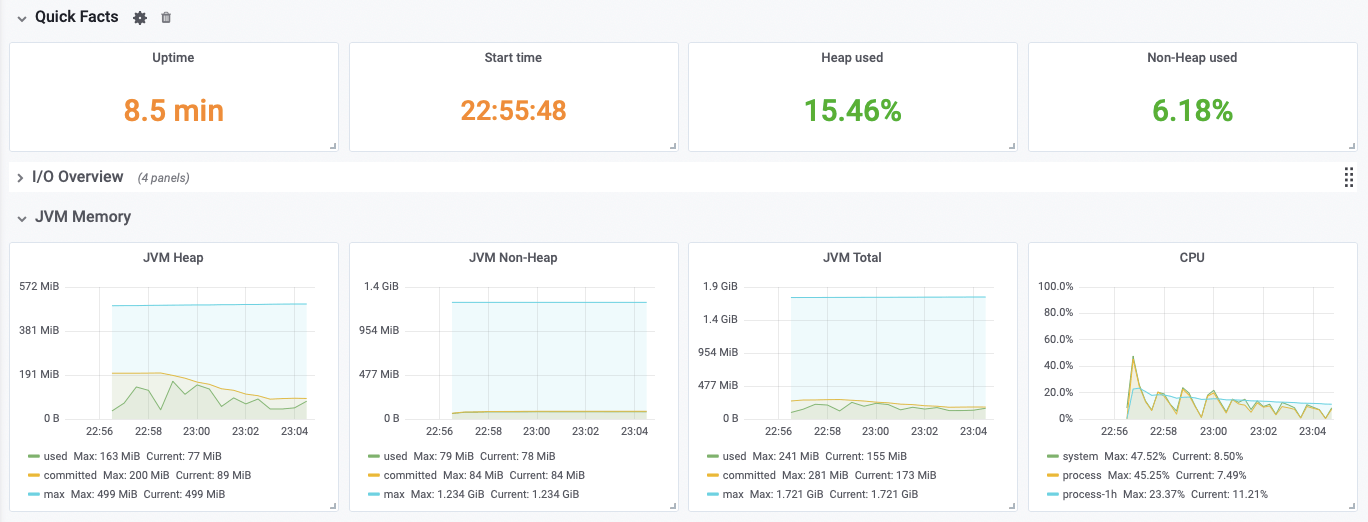
I strongly encourage you to visit Grafana demo page - where you can experiment with a running instance and explore the full potential of Grafana dashboards.
Putting it all together
So far we have identified the building blocks of our metrics collecting system. Combining them together allows us to create a system to collect, store and track crucial data during the application runtime, as well as to alert us to undesirable system behaviour.
A sample architecture for a microservice with monitoring is as follows:
For the application we used Spring Boot 2.x along with Spring Boot Actuator and Micrometer. Within the application we have defined metrics that are crucial for our domain such as time to invoke important business methods as well as JVM and response time metrics.
For monitoring we decided to use Prometheus so we included the Micrometer Prometheus registry client dependency in the microservice itself so that Spring can easily detect our client and connect it to Prometheus.
The last element is Grafana. It's where we query and visualise data stored in Prometheus. We can fetch the metrics and create self-describing dashboards that can be used to easily monitor the application runtime. In addition we can define alerting that can message us via notification providers when some of our metric values change in an undesirable way.
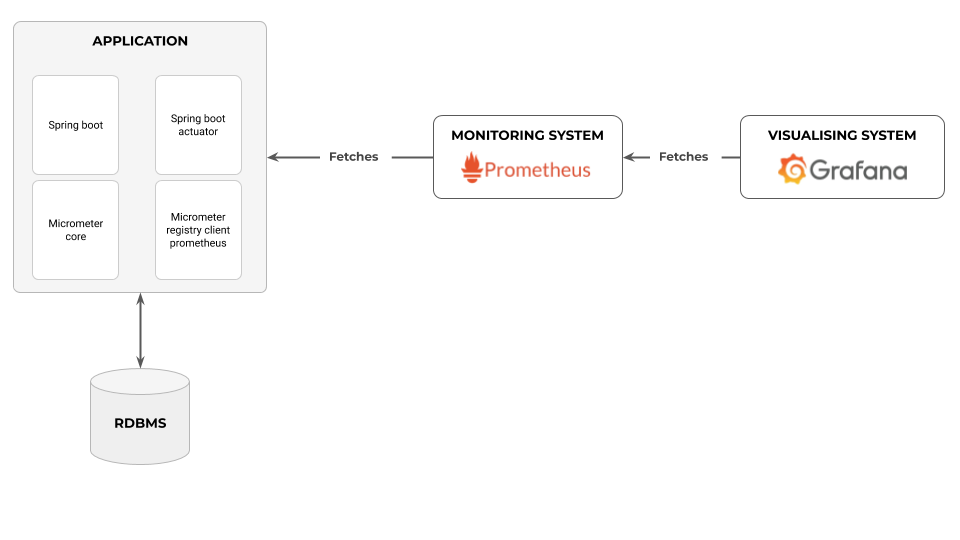 Sample application with Monitoring
Summary
Microservices have made it more difficult to get a coherent view of the state and health of applications. The building blocks presented, in combination with well defined measurement criteria, help us build microservice-based software systems that can be readily monitored, diagnosed, and maintained. The combination of using Spring Boot and Micrometer gives us the flexibility to use a variety of monitoring systems without having to fundamentally change our architecture, while Grafana provides us with a powerful monitoring system.
If you'd like to experiment with the code described, our colleague Jędrzej Serwa has put together a sample repo on GitHub. Feedback welcome!