POSTED ON 19 APR 2018
READING TIME: 10 MINUTES
A closer look at Looker
Many of the development projects we carry out at Sonalake involve an element of data visualisation. In some cases we build bespoke software, in others we embed open source or commercial reporting and visualisation tools. As the space is constantly evolving, we regularly review the most interesting and promising BI tools. It is through this process that we discovered Looker and chose to embed it within a data analytics development project for a large customer.
Looker is a business intelligence and big data analytics platform which aims to make the processes of connecting, reporting, and analysing data more enjoyable. In this post we'll have a closer look at Looker, from connecting to data sources to creating and visualising reports.
Data sources and storage
Looker can connect to any SQL database and supports more than 35 SQL dialects - by any count, this gives Looker comprehensive coverage of today’s database technologies. Database setup is easily done by setting up a Connection. In a few simple steps you’ll be able to read from any of the different databases and dialects provided.
Metadata management
Once database connection is established, the next step is to create the metadata layer. It acts as an abstract intermediate layer between data sources and the visualizations built on it. In Looker, this layer is represented by a LookML (Looker Markup Language) project, which provides a clean and organized way to describe data representation. Worth to notice, in the same project we have the ability to collect data from different data sources, as long as they are in separate models.
At this stage a user can also perform (amongst other very cool features):
- Security: Defining access filters, to provide row-level security. For example, in a multi-tenant scenario, you can use an access filter to ensure a tenant would only ever see its data.
- Calculations: You will have a variety of functions (including logic functions), to combine your data to derive information.
- Define measures: By defining new measures, we can apply aggregation functions on the result set of a query. For example: sum, sum_distinct, count, avg, etc.
- Data format: Select which format you want to present your data. Is this a numeric value with two decimal places? Or maybe add the euro symbol for all your monetary value information.
Looker provides a browser-based IDE that allows developers to develop their LookML projects, which are also version controlled using Looker’s integrated Git.
The LookML code is intuitive and quickly understood by anyone with basic SQL experience and knowledge of XML. Also, object-oriented enthusiasts like myself, will feel very comfortable as you’ll be able to describe your model using extensions (similar to inheritance), even being able to override attributes from one hierarchy to another. This means you can abstract common functionality, and have a clean and neat model.
The screenshot below is an example of a LookML project open in the IDE.

When creating a LookML project users can choose to start from scratch or have Looker auto-generate the project by inspecting an existing SQL schema. The latter approach is a great way of quickly bootstrapping a project, from where you can fine tune the LookML to suit your needs.
For version control, Looker makes use of Git. One slight limitation is that there is no mechanism to select which branch/tag production projects work off - production always points to the HEAD on master. This complicates working on different instances, when you might need to maintain different release versions of your LookML project.
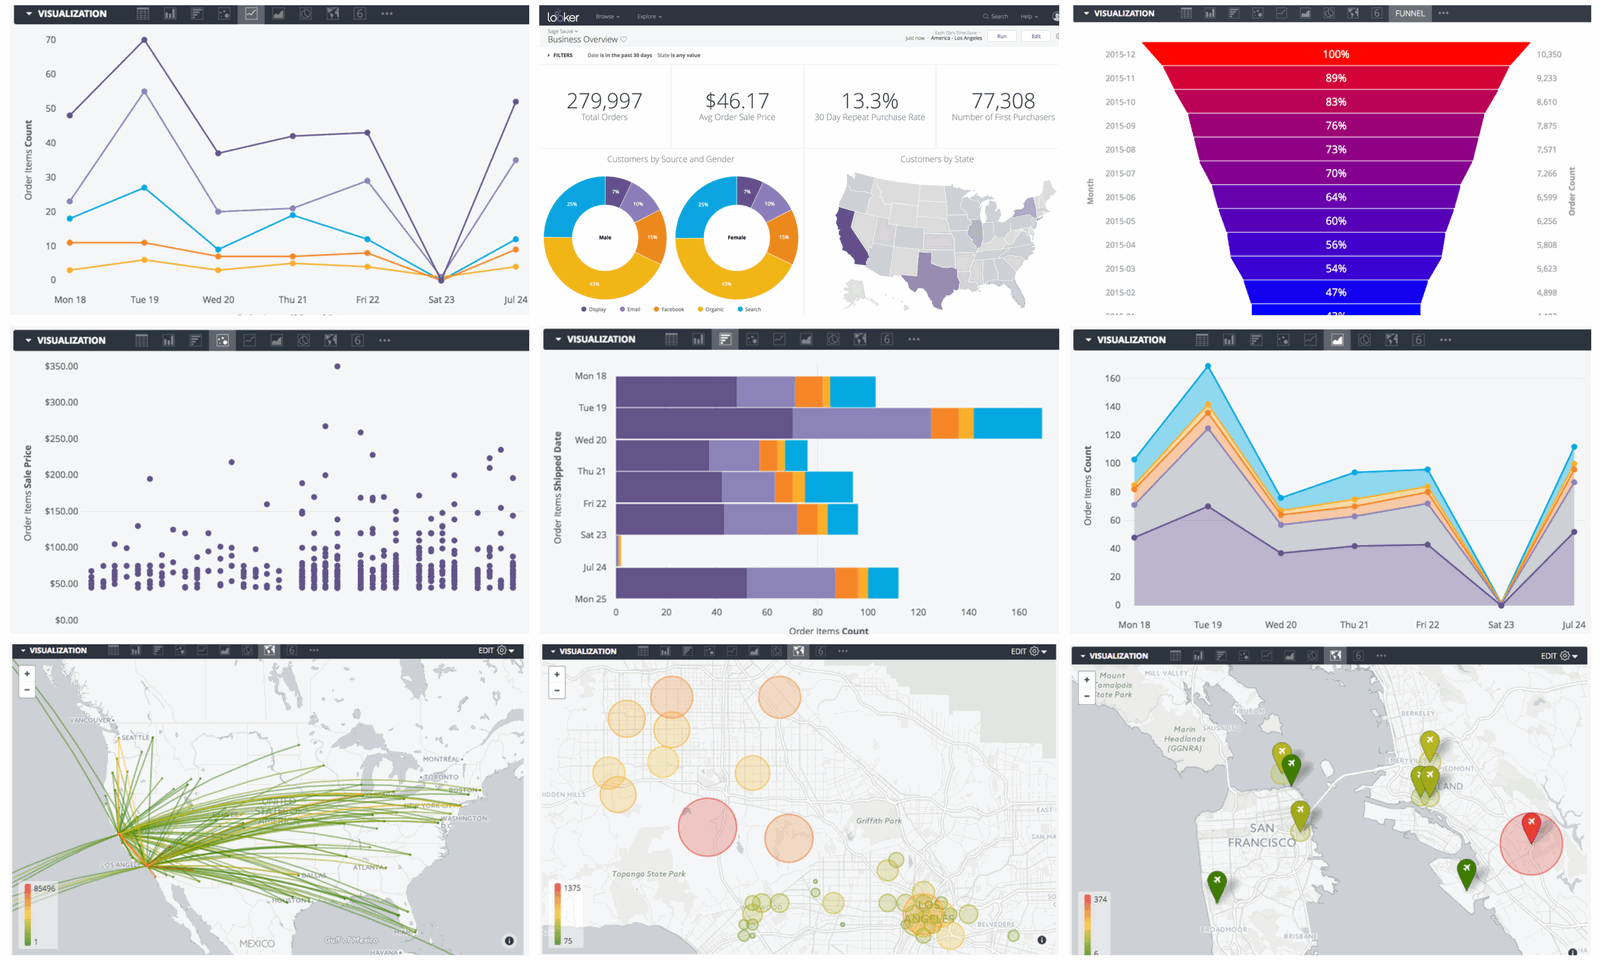
Dashboards and visualisations
With the metadata layer in place, the user is able to construct Looks (visualizations). A Look consists of a query, any number of filters and a visualization type. Looker offers 14 different visualizations out of the box, all of which have different settings allowing users to modify its representation.
Even though it might not provide as many visualization options when compared to more established tools, you’ll have the ability to extend the set of existing options by creating custom visualizations via Looker Visualization API. All you need is a self-hosted Looker instance, and some JavaScript knowledge.
Looks can then be arranged to form dashboards.
Dashboards
Dashboards are essentially a collection of Looks that are laid out according to user preferences. You can add filters, to be applied to one or more looks, and also a Text tile, which interprets a subset of Markdown tags. The Text tile is particularly useful to define landing pages, adding images or links to the dashboards, or even having a simple description text to inform the user about the purpose of that dashboard, and what questions does it aim to answer.
All of those elements can be easily laid out by drag-drop and resizing the tiles.
Looker also provides users with the ability to test and familiarise with beta features, through Looker Labs. One of those features which caught our attention is the ability to drill from Looks/Dashboards into other dashboards, filtering by data values. Imagine you have a Revenue table listing all the sales regions of your company, with their respective values. You might notice that one region differs significantly from the average and you’d like to identify the reason behind it. By using the drill down feature, you’ll be able to, within a couple clicks, go from the Revenue table into a specific Sales Region dashboard, and see more details about it.
It is also possible to browse and search through dashboards based on popularity, authors, favourites and more. Looker uses the concept of Spaces which can be personalised and shared, to enable users to create, organise and manage their own dashboards. A Space can include Looks, dashboards and more Spaces (subspaces).
You can also save dashboard files into the LookML project thus putting them under version control.
Alerting and scheduling reports
Looker allows for scheduling periodic delivery of a Look or Dashboard. The schedule can be configured according to a set of cron-like patterns and delivered using a variety of delivery channels ranging such as email, webhook, Slack and Amazon S3 buckets.
Alerting can be achieved by scheduling reports that are only sent when certain user-defined conditions are met. This is a nice feature in a scenario where, for example, you want to be notified every time your inventory drops below a certain level, or a failure rate exceeds a limit. There’s also the option to only be alerted if results have changed since the last run, which avoids wasting time on querying results that comply with the existing filter and protects the users from inbox overflow.
Embeddability
Looker provides options for embedding Dashboards and Looks both publicly and privately on websites, portals or applications. It provides the ability to white label or OEM the entire Looker platform for the end user's product.
Looker also provides REST APIs both for managing an instance and fetching data from it. See below a few example of what you can achieve via API requests:
- Create Looks and Dashboards
- Run Looks (retrieve data)
- Manage Users, Groups, Roles
- Create Schedule plans
- Manage database connections
They also provide a ruby SDK for their API and also a Swagger file for generating SDKs in your preferred language. Having an SDK is a big plus when creating automation scripts for things like onboarding new tenants, adding new users, releasing new dashboards, etc.
These APIs expose a wide range functionality, however there are some gaps, specifically in relation to automating configuration (git-related actions, general configuration, etc.).
Authentication & role based access control
By default Looker authenticates users with an email address and password. It can also be setup to use LDAP, Google Authentication or SAML. For enhanced security the administrator has the option to set up two-factor authentication.
Looker provides a comprehensive view for managing users, their roles and permissions. There are three authorization levels, that define access control for all aspects of the application:
- Functional level: By altering the permission set, you can define what functionalities are available to each role.
- This includes admin/tool management and Visualization and data manipulation functionalities.
- Data level: You can define a specific set of data, which will be associated with a role, in order to define what data it'll have access to. Row-level control access is also possible by configuring your metadata layer (LookML project).
- Visualization level: You can configure which groups or users can access each Space (and what type of access, read or write), and therefore all content available in them.
Deployment & multi-tenancy
Looker is available in either cloud or on-premise configurations. The Looker platform does not have any native apps for Android or iOS however dashboards have native mobile rendering.
Multi tenancy is provided by properly configuring your Looker instance. By doing it, you’ll have all the groups (at least one per tenant) isolated from each other. This isolation is achieved by defining correct access and model permissions for each Group of users (and their respective roles), so that when a user logs in, they will only have access to the data and reports their tenants are configured to have.
Unfortunately, though, Looker does not provide restricted user admin (or an user admin per group), so all user management is centralized in the single Admin role, which has access and control over all tenants (in this scenario it really helps to have an API, to make the process of onboarding a tenant as easy as possible). You also won’t be able to configure home pages for each tenant, or even configure Look and Feel on a tenant basis.
A nice method of testing user configuration is the ability to impersonate (sudo) another user. By doing that, you’ll be looking at Looker with another user’s eyes, so you can make sure that user will only have access to the right Spaces and data.
Scalability
Looker itself feels lightweight and responsive, even though it delivers powerful functionalities. It can be configured to run as a single-node application or in a clustered environment. Its recommended that before clustering, there's clarity on the use of the system, in order to identify possible infrastructure upgrades (memory or CPU). For instance, if there are a small number of large queries, clustering would not be a suitable solution, whereas upgrading memory would
Final thoughts
Looker makes the process of analysing and reporting on your dataset an easy and enjoyable task, by providing a web-based tool that gives you centralized and straightforward configuration, along with beautiful visualizations and rich interactions in the reports.
Having all functionality put together into a web interface is one thing that Looker has been very successful in achieving: from dashboard visualisation and design to metadata definition and user management. It presents dashboard viewers an attractive and interactive experience, whereas report designers have a quick and easy way to create Dashboards. For developers, it provides the LookML language, which lets them easily define metadata in a portable format that is git-friendly, and also the capability for automation via Looker API as well as creating custom visualizations.
Some functionalities can be improved (such as API support for configurations and git support), but overall it is an awesome tool, with very good documentation and support (including in-app live chat support), and with a 4-week release plan, you’ll always have something new to look forward to.